







Integrated Data Management: The Cowboy Method Rides Off into the Sunset
First things first. Let’s define the “cowboy method” in the context of offshore fieldwork: a colloquial term for getting the job done by instinct, on your own terms, and on the fly. Cowboys trust their gut over a checklist, and they rarely leave notes behind for whoever comes next. And for decades, this mindset has defined offshore decommissioning.
Pricing, project timelines, vendor performance, and lessons learned often exist only to be reported to clients at closeout. In the best-case scenario, they live in separate digital file systems where each insight stays limited to that one situation. Cowboys keep riding in circles, approaching the same challenges time after time, never building on what they already know, and leaving value untapped in an asset’s final years.
It’s time for the industry to blaze a new trail.
Leaving the ‘Wild West’ behind
Most of the industry’s infrastructure was built to find and produce oil, so its databases track things like reservoirs, production, and drilling performance. Decommissioning creates liability rather than revenue, so few organizations ever prioritized building systems that capture what retiring an asset can teach them.
Promethean Energy proves there’s just as much value in applying discipline to late-to-end-of-life asset management as in the earlier stages. By planning for retirement earlier in the asset lifecycle, operators can be responsible stewards who maximize value.
One connected view of every operation
We’re building our data foundation with machine learning in mind, one workflow at a time. At its core is a centralized data lakehouse that brings safety observations, action items, and regulatory information together. Every day, new cost, operational, vendor, and project data adds to that foundation, creating an increasingly complete picture of our work and a growing body of knowledge we can learn from and apply to future projects.
Rigid enterprise tools often fall apart when they force everyone into one package or template. Our approach starts with the records our work already produces instead of adding a parallel reporting burden. Daily progress reports, invoices, observations, and vendor records are generated as a by-product of the job, and automated flows already pull key data from daily reports and invoices into structured formats that can be analyzed together.
How integrated data management works
We’re steadily capturing, recording, compiling, and organizing data at every stage of sourcing, planning, execution, and improvement, from vendor rates and fuel consumption to hazards spotted on deck and hour-by-hour field activity. Every data point we add makes the next project safer, more predictable, and more cost-effective.
1. Record everything
Operational transparency requires careful documentation. We capture both structured and unstructured data to build a comprehensive, defensible record of past projects. When numbers and context intersect, it’s easy to do it better every time.
Structured data captures the quantitative data that matters most
We carefully rely on specialized external platforms for the jobs they do best. Each comes with its own structured database, business intelligence layer for charts and reporting, and interface for the team that uses it.
Field activity platform
Anyone on location can log what they see, photos included. From there, an observation takes one of two paths: It either becomes a lesson learned or a service quality event. Observations and the action items they generate now flow into our lakehouse, where each one carries a named owner and stays open until there’s evidence it was closed. Lessons learned then feed the risk register for the next project.
Contractor compliance platform
This vendor tracking platform records who is qualified, onboarded, and compliant before anyone mobilizes. It’s the backbone of our approved vendor list, which tells us exactly who can provide which solutions when it’s time to go to market for competitive bids.
Cost management platform
Invoices, line items, and day rates are all recorded here. Once invoices are scanned and their line items extracted, they become searchable. Finding every invoice that includes an overweight charge, for example, takes one search instead of an afternoon of digging. An AI-assisted review gathers each invoice’s supporting documents, checks completeness and arithmetic, and flags vendor mismatches before payment.
Unstructured data reveals the full story
Project knowledge traditionally disappears when organizations don’t capture their unstructured data. But when every project touchpoint captures insight into what worked, what didn’t, and why one approach was chosen over another, that knowledge extends far beyond a single project.
Emails and communications
These communications carry critical insight into decisions, approvals, scope changes, and vendor quotes. They hold the reasoning behind the numbers and often vanish after closeout.
PDFs and field documents
These sources include invoices, well files, and the daily production and cost report. The daily report logs hour by hour what was done, what the day is expected to cost, and who was on location. Our operations procedures now formally define it as the consolidated record of offshore activity, cost tracking, and project controls.
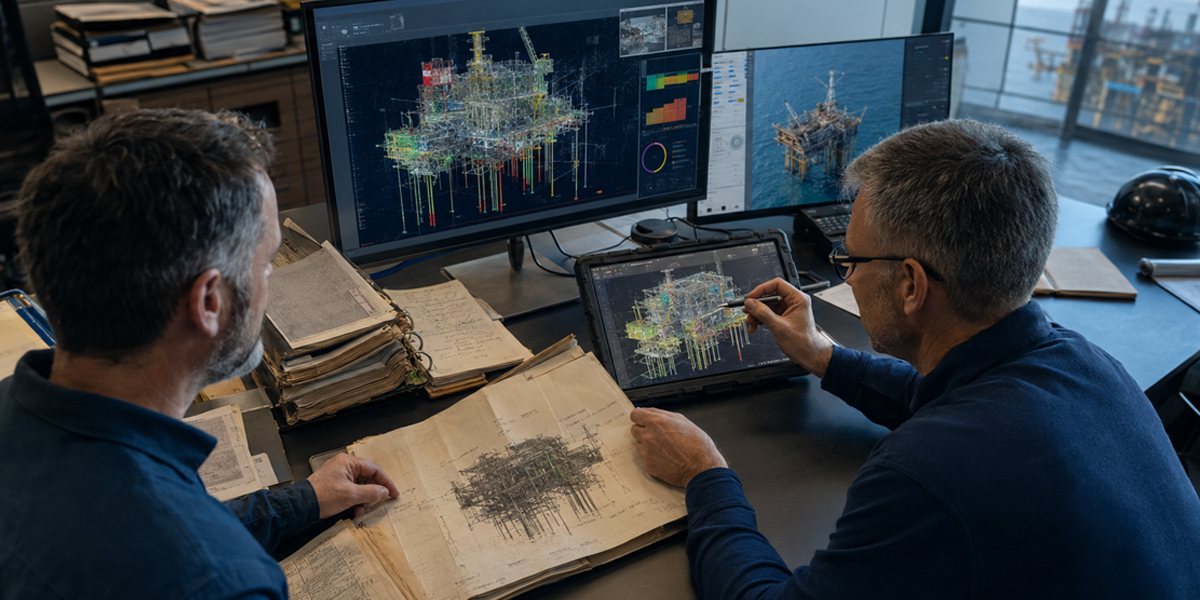
Every document we file is tagged to its block, facility, well, or pipeline, so records stay traceable to the asset. As our portfolio grows, a single workbook can cover several platforms and task orders at once, so we add structure that makes each operation readable on its own. Well files can run to hundreds of pages of decades-old, sometimes handwritten history; today’s AI models can read even handwritten records and scan them for the details that matter.
Firewalled external sources
These include public regulatory data and partner systems. We control who can access them so that outside data can come in without exposing ours. When AI is involved, the first question any operator should ask is where their data goes.
2. Compile
A growing share of our data now lands in an internal environment that Promethean Energy controls and administers, starting with observations, action items, and regulatory data.
Data the team needs every day, such as pricing pulled from invoices, moves through automated flows into a structured data environment. This ensures that no one waits on a manual update.
Low-frequency data moves by scheduled download into a flexible input layer. Our standard is for each external platform to export on a set cadence, weekly for most, to the same location. Each new export refreshes the working copy so that every other tool draws from the most current version. The full history stays intact in the source platform.
3. Structure and contextualize
A raw number doesn’t tell you much on its own. A day rate only becomes useful once you know which well, vendor, day, and phase of work it belongs to. Two kinds of pipelines add this layer of context.
Connections we build and own
Our built-in pipelines compile internally sourced records into a shared structure that allows field, finance, and operations information to be read together.
Cost, safety, and operational data move into one structure, and our dashboard program already combines daily progress report entries, daily cost and earned-value data, and safety observations into a single view. Tables from the daily report are converted into structured records that sit alongside invoices and personnel records. Once that conversion is done, trends become visible, including fuel burned per operation, cost per day by vendor, and time spent on each step of the work. Without those trends, there’s no accurate basis for estimating the next project.
Connections supplemented by partner pipelines
We connect specialist AI platforms to the same foundation. Our abandonment planning partner, for example, ingests legacy well files and returns the evidence our engineers need, while others are piloting context layers that read across our documents and records. We don’t try to build every tool ourselves. Instead, we find the companies doing the most capable work in a given area, connect their technologies to our structured records, and put those systems to work.
4. Deliver it where it’s needed
Once data has been recorded, compiled, structured, and connected, it delivers four things:
- One trusted operational view: Operations, finance, and safety teams increasingly work from the same numbers. On our daily operations calls, an AI assistant captures decisions and assigned actions in a searchable record so that what’s agreed doesn’t get lost between shifts.
- Secure enterprise-wide access: People get the information they need, and the data stays inside an environment we control.
- A foundation for analytics, AI, and automation: Structured, contextualized records provide a predictable, accurate baseline for machine learning.
- Total transparency, easy traceability: Our standard is for every cost to tie back to a source document, and invoice review already checks for that support before payment. When billing runs on spreadsheets, rolling up documents for an audit invites confusion, back-and-forth, and potential discrepancies over whose numbers are right.
The tried-and-true building blocks
Here’s how we’re getting better with every project.
Central data lakehouse
We store all our most critical data points in one integrated environment. Operational and vendor observations, action items, lessons learned, and regulatory data are all understood as pages within the same story.
An observation from the deck becomes an action item with a named owner, stays open until there’s evidence it was closed, and feeds the risk register for the next project. With regulatory data in the same place, our engineers have a faster path from a well’s history to a defensible plan.
Automated data flows
Daily reports and invoices are two of the richest records our work produces. Automated flows now pull key data from both into a standardized operations history, so trends in activity, cost, and time no longer depend on someone copying numbers by hand.
AI-assisted invoice review
Before an invoice is paid, an AI-assisted review gathers its supporting documents, checks completeness and arithmetic, tests it against our policies, and flags vendor mismatches. Our team still approves every payment. The review makes sure they’re looking at the full picture when they do.
Integrated dashboards
Our dashboard program combines daily progress report entries, daily cost and earned-value data, and safety observations into a single view. Instead of piecing together three separate reports, project leaders can see field activity, spend, and safety side by side.
AI-assisted daily operations calls
Our daily operations calls have evolved from status updates into a strategic risk-management effort. An AI assistant captures decisions, questions, and assigned actions in a searchable record. Our operations team now brings the project risk register into safety reviews on its own initiative, which means today’s crew challenges the day’s plan with what earlier crews learned.
Thirteen owned ESG metrics
Each of our 13 ESG metrics has a named owner, a defined source record, a review cadence tied to an existing routine, and a specific decision it supports. Fuel consumption, for example, is drawn from daily reports and fuel invoices and used to make vessel sequencing and standby decisions. A metric with no owner or decision attached is just reporting, so none of ours work that way.
AI-enabled safety observations
Our camera-based safety system feeds a correction loop that’s now part of routine supervision. When an observation points to a design problem rather than a behavior — for example, a valve that can only be reached by entering a barricaded area — it goes to engineering review instead of a coaching conversation. That’s how a single alert can remove a hazard for every crew that follows.
Faster abandonment planning
AI-assisted retrieval reads a well file and returns the casing and cement records, barrier placements, and pressure history our engineers need, each linked to the page it came from. In early application, that cut abandonment planning time by 85%. For a well with an integrity concern, the speed matters. Every week saved between identifying a problem and getting approval to fix it is a week less of potential exposure.
A disciplined build plan
Our integrated data working group meets weekly to weigh what to build, what to buy, and what to connect next, guided by feedback from the people who will use each tool. Every new capability is measured against our existing manual practice before we adopt it. That’s how each piece earns its place.
The best last steward for upstream assets
Early on, we said the cowboy approach keeps offshore operators riding in circles. Integrated data management is how we break the loop. Every vendor rate, observation, and daily report becomes part of a record that makes the next project safer, more predictable, and more cost-effective. And every job helps shape a new baseline for responsible stewardship.
 Share